Sea Ice Mapping and Uncertainty Quantification
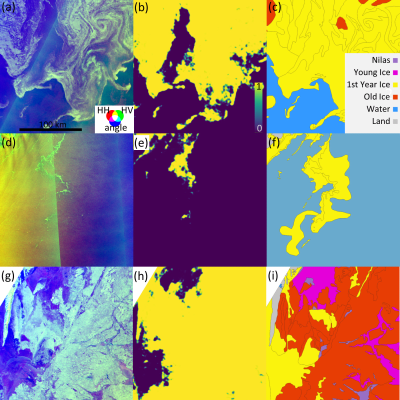
Sea ice charting is vital for navigating safely through icy waters and for scientists studying climate change in polar regions. Traditionally, experts at national ice centers manually interpret various types of satellite data to create sea ice maps using a standard called SIGRID-3. This manual process is slow and struggles to keep up with rapidly changing conditions in the Arctic. Our project aims to speed this process up while making it more accurate by using geospatial principles in developing deep learning methods, using high- and low-resolution satellite imagery.
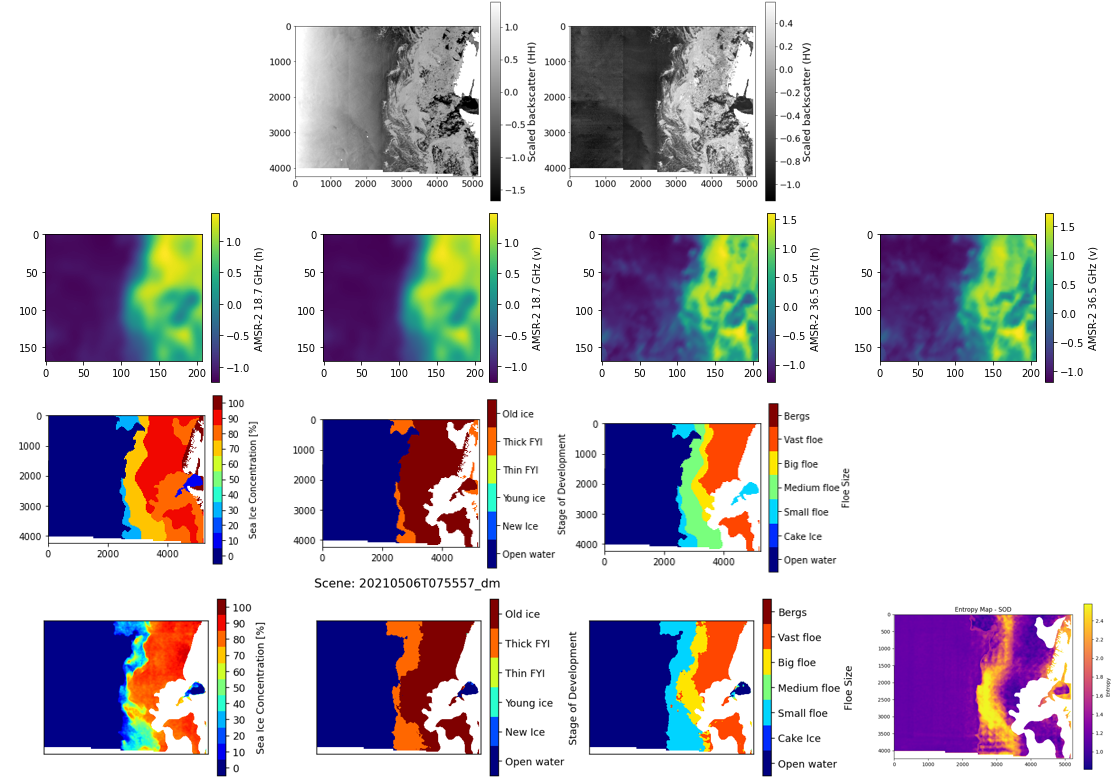
We primarily use data from Synthetic Aperture Radar (SAR) and Passive Microwave sensors (and some lidar altimetry in related projects ). SAR works by sending radar signals from satellites and capturing the reflections, providing images that can see through clouds and darkness. Passive Microwave sensors detect natural microwave signals emitted by the sea ice, useful for understanding ice concentration and type. These technologies are powerful but come with challenges—different ice types can look similar in satellite images, causing confusion for both a human or algorithm, and the level of detail (spatial resolution) varies with the sensor type, affecting the accuracy of ice charts.

Intellectual Merit
Our project advances the field by integrating SAR with Passive Microwave data through deep learning, and developing training methods to fully utilize limited training samples available to scientists. This integration partially helps tackle the problem of signal ambiguity—where different ice types may appear similar. We are also developing new ways to enhance model accuracy using specialized algorithms that consider the varying levels of detail captured by different sensors, as well as partial concentrations of sea ice in training labels. Additionally, we explore how transfer learning, a method where a model developed for one task is reused on another, can be adapted for SAR data to handle different ice conditions more effectively.
An essential part of our work involves quantifying how certain the model is about its predictions. This uncertainty measurement lets sea ice chart analysts trust, correct, or verify the automated maps, ensuring they can be used confidently in real-world navigation and research.

Broader Impacts
By automating sea ice charting, we make it possible for ships to navigate polar regions more safely and efficiently, potentially opening up new maritime routes. More reliable and timely maps also aid climate scientists in monitoring how quickly ice is forming or melting, which is crucial for understanding global climate change. This project not only demonstrates the potential of AI in environmental science but also showcases technological applications in better monitoring and studying our planet.


