Geographic Forecasting of COVID-19 Case and Hospitalizations Incidence
The COVID-19 pandemic’s severe impact highlighted the need for accurate and timely forecasting of case and hospitalizations in each state and county to enable effective planning and resource allocation. The need for medical equipment across the country was so severe and timely that at times, states outbid each other to obtain such resources. Traveling nurses were sent around the country to help alleviate strain on local healthcare providers.
The US COVID-19 Forecast Hub, coordinated, standardized and created centralized infrastructure for scientists and epidemiologists around the country to submit case and hospitalization forecasts every week to help support operational planning. These forecasts were then evaluated, combined, and ensembled for reporting by the U.S. Centers for Disease Control and Prevention. The methods standardized by the Forecast Hub has now become the standard way for forecasting flu, COVID-19, RSV, and even West Nile Virus forecasting in the US, and has inspired the European Forecast Hub.
During the pandemic, however, it became quickly clear how challenging the task of forecasting was, and how models were failing. Case forecasts were not reliable, and hospitalization and deaths forecasts, while more reliable, still left more to be desired. Most forecasting models struggled, especially during new variant surges, when they were most needed.
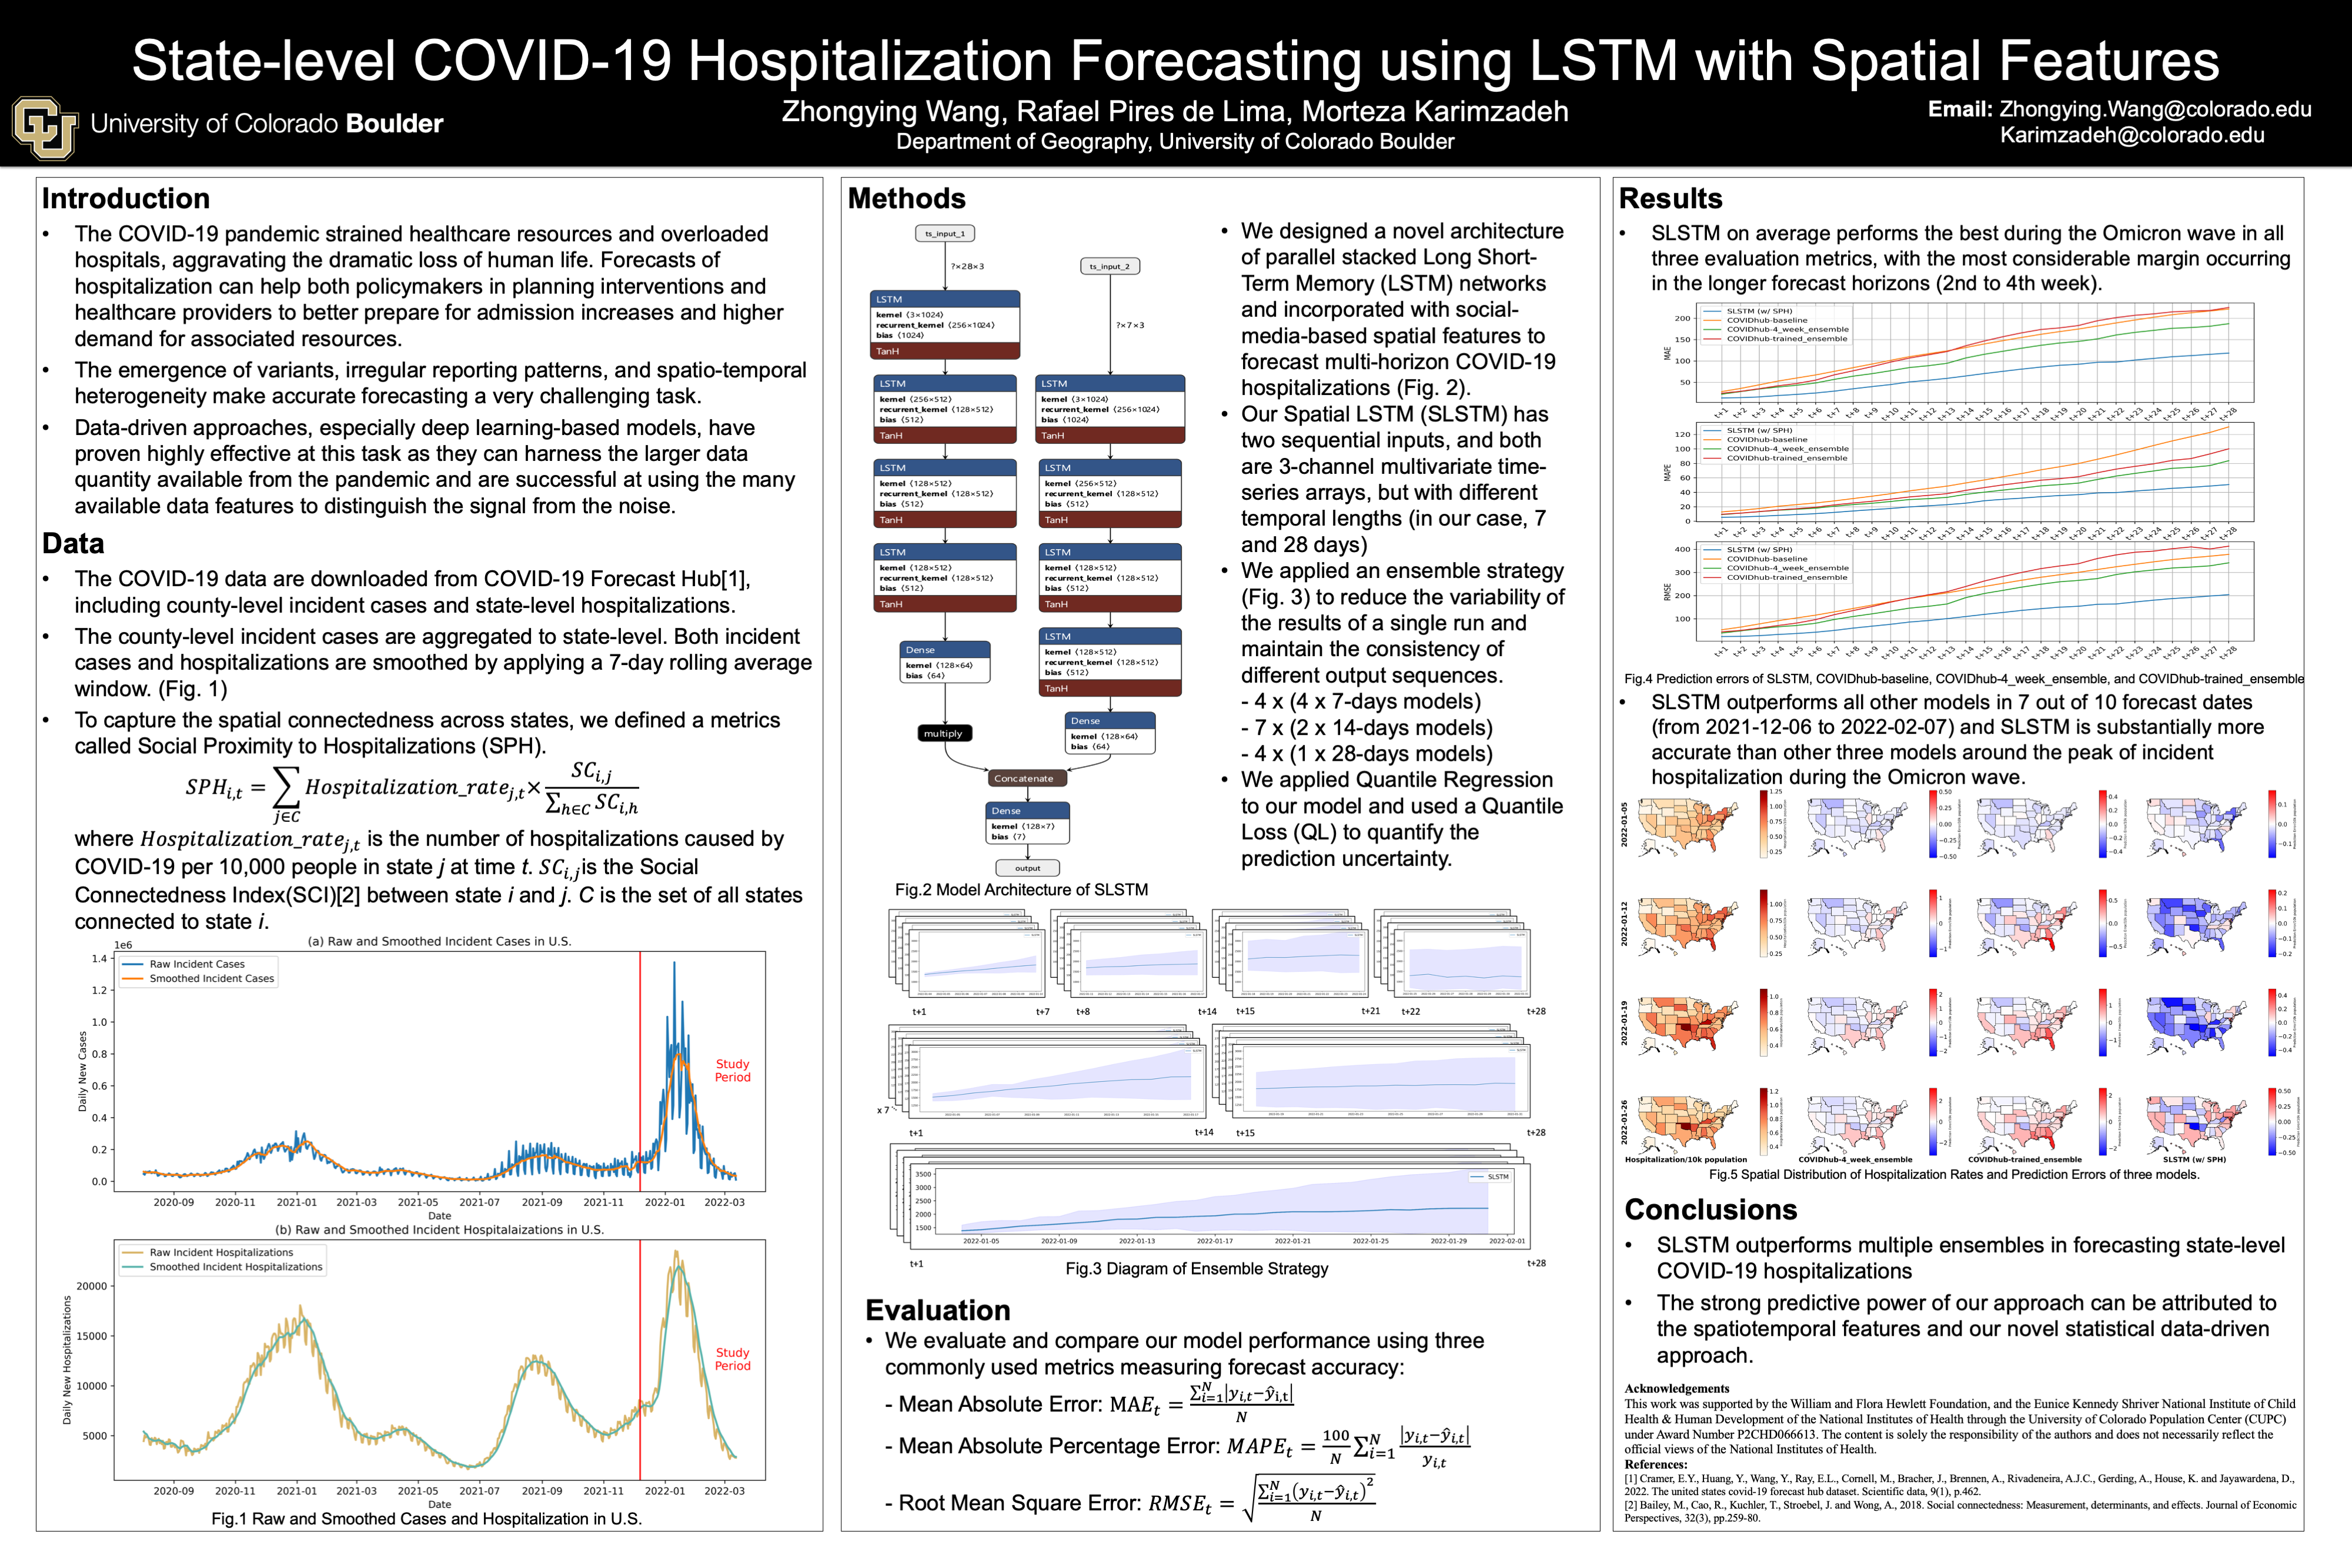
In collaboration with Population Council, we were one of the active teams throughout the pandemic to submit weekly forecasts to the Hub using machine learning by integrating spatiotemporal features. Our models, according to our own as well as independent evaluations, were relatively successful in capturing the trends within prediction intervals, especially during peaks (see our publications, linked below.)
We extended Long Short-Term Memory (LSTM) networks for forecasting daily state-level incident hospitalizations in the U.S., as well as weekly case forecasts for U.S. counties. Notably, we realized early on during the pandemic that county-level and state-level social media connectivity helped quantify the amount of spread from one county to another (or one state to another).
We used social media connectivity to created proxies for inter-state and inter-county population interaction, capturing transmission dynamics across space and time. We also developed multi-horizon ensembling strategy to balance between consistency and forecasting error.
Evaluations at multiple stages showed that our relatively simple models were effective and superior to most other models during the forecasting period. For instance, evaluating performance against the COVID-19 Forecast Hub ensemble model during the Omicron surge shows consistent superiority of our model. On average, our model surpasses the ensemble by 27, 42, 54, and 69 hospitalizations per state on the $7^{th}$, $14^{th}$, $21^{st}$, and $28^{th}$ forecast days, respectively. Data ablation experiments confirm the spatial features’ predictive power, highlighting its effectiveness in enhancing forecasting models. This research not only advances hospitalization forecasting but also underscores the significance of spatial spillover features refined using social media data, in improving predictive performance in modeling the complex dynamics of infectious disease spread.


